Netdata service monitor – monitors CPU, memory, disk, network, process metrics and many other additional metrics.
netdata is a system for distributed real-time performance and health monitoring. It provides unparalleled insights, in real-time, of everything happening on the system it runs (including applications such as web and database servers), using modern interactive web dashboards.
netdata is fast and efficient, designed to permanently run on all systems (physical & virtual servers, containers, IoT devices), without disrupting their core function.
netdata runs on Linux, FreeBSD, and MacOS.
Requirements:
It should run on any Linux system (including IoT). It has been tested on:
- Alpine
- Arch Linux
- CentOS
- Debian
- Fedora
- Gentoo
- openSUSE
- PLD Linux
- RedHat Enterprise Linux
- SUSE
- Ubuntu
For Debian/Ubuntu first of all we will install curl:
apt-get install curl
On Debian/Ubuntu and CentOS/Fedora, there is one line installation script that will install latest netdata and also keep it up to date automatically.
bash <(curl -Ss https://my-netdata.io/kickstart.sh)
OR (with all plugins)
bash <(curl -Ss https://my-netdata.io/kickstart.sh) all
After Successful install you just need to open the port no. 19999 only if you’re running firewall like eg. CSF (CWP panel) and firewall like VestaCP (firewalld) or any other.
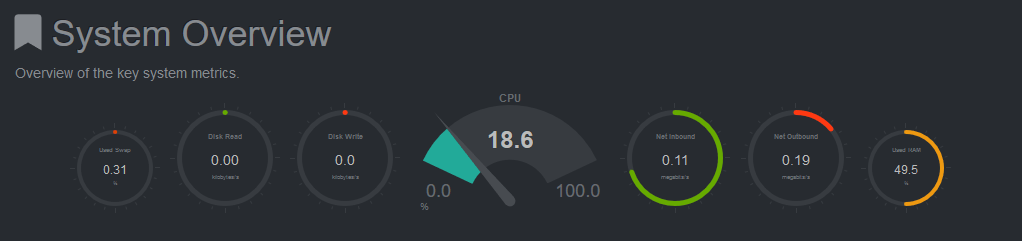
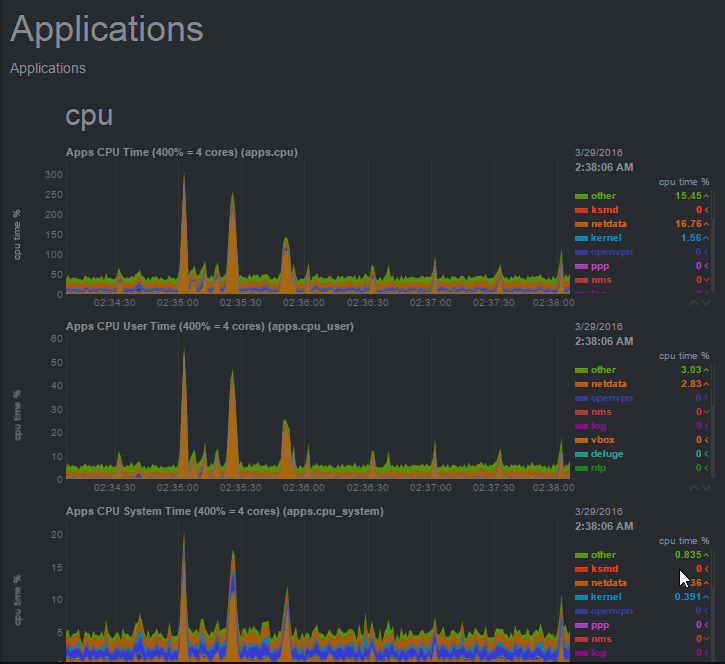
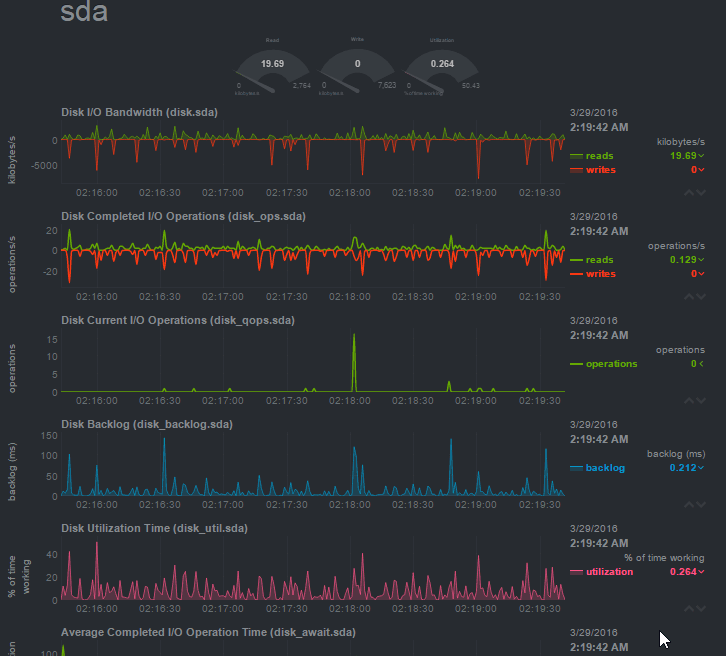
After installation visit http://your-server-ip:19999/ in your browser to access the GUI dashboard.